

EST. 2014
Monetization
Platform
WMG International (known as adWMG) provides pioneering ad tech solutions for advertisers and niche publishers worldwide. Tailored, tech-driven advertising to ace personalized goals.


Certified by:


For Direct
Publishers & SSPs
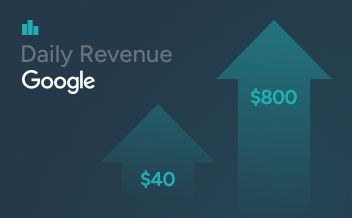
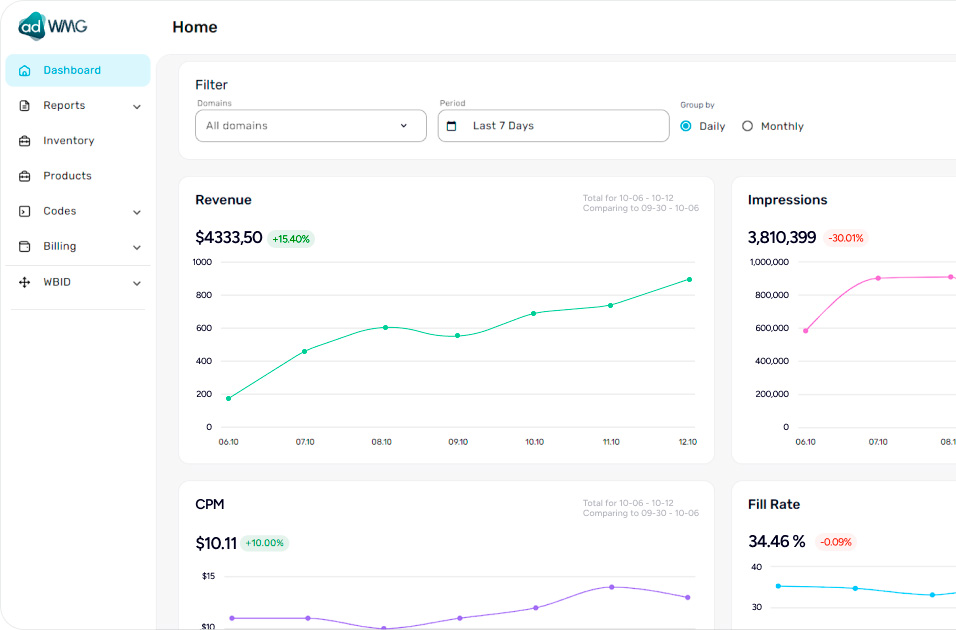
Our sophisticated Analytic Report feature can gather, generate, and analyze large amounts of data in real time. Protecting your information on our secure servers, WMG allows you to use numerous filters and metrics that allow you to build and customize effective monetization strategies.
They trust us:


JavaScript
Tag
Tag
openRTB
endpoint
endpoint
VAST
Prebid
Client Side
Client Side
10 Billion
Ad impressions monthly
30
High-quality SSPs
9 000
Direct Websites
10 000
Mobile applications
Simplifying complicated technologies, WMG
creates products for
programmatic monetization
creates products for
programmatic monetization
About us in the Media

adWMG & Azerion Enhanced Games Revenue Applying Cross-Device Targeting
adWMG is a part of global WMG International - a focused monetisation
and promotion platform focusing on
providing professional advertising
services for console game developers/
publishers and monetising web, CTV...
and promotion platform focusing on
providing professional advertising
services for console game developers/
publishers and monetising web, CTV...

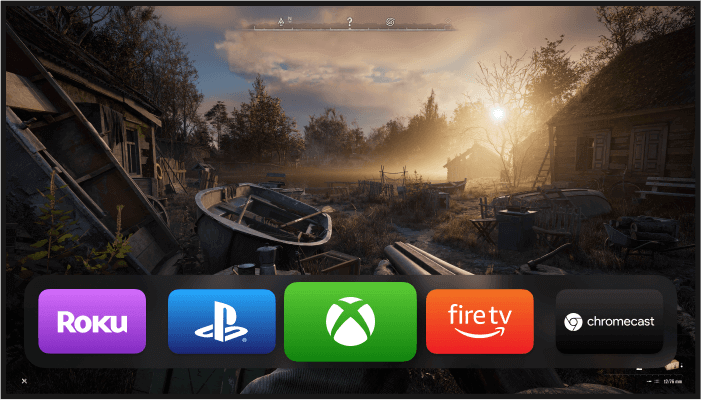
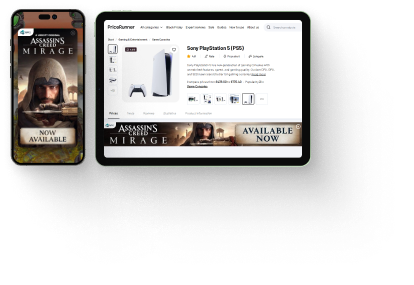
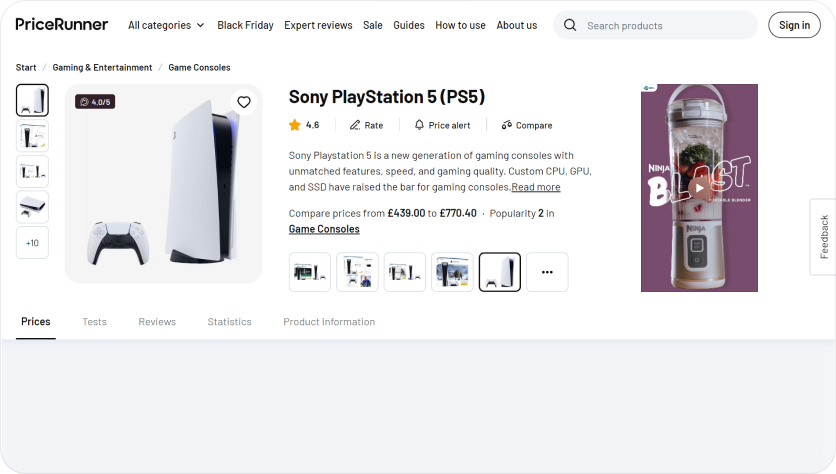
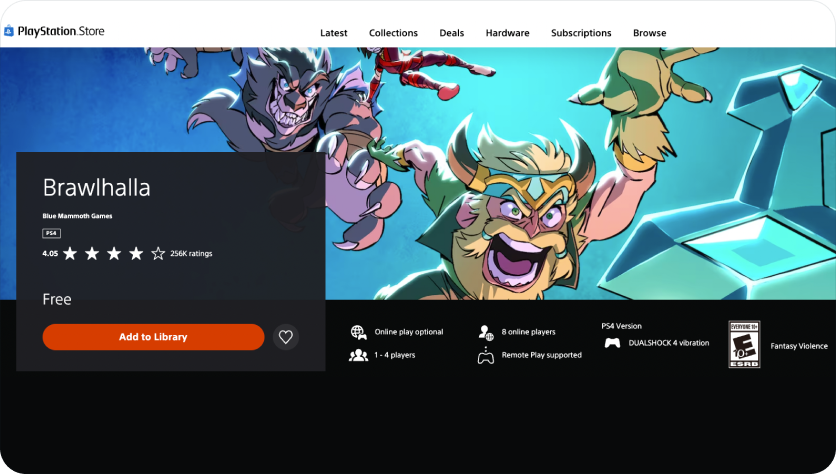
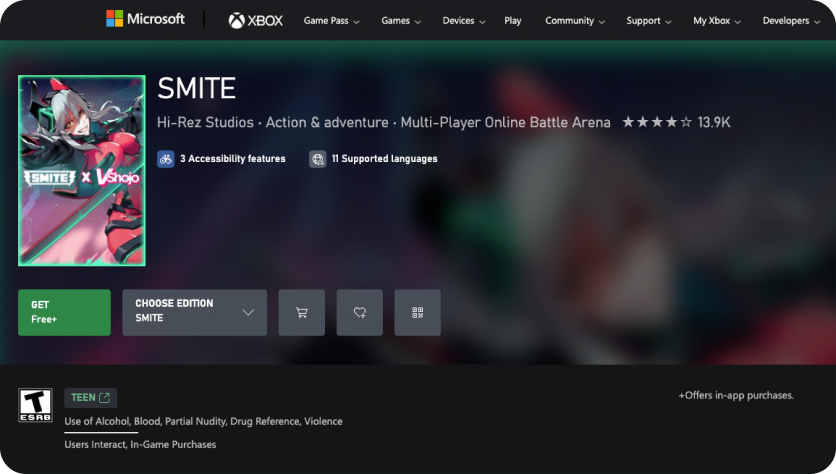
How adWMG connects Xbox/Playstation inventory and mobile app installs
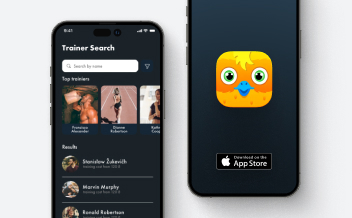
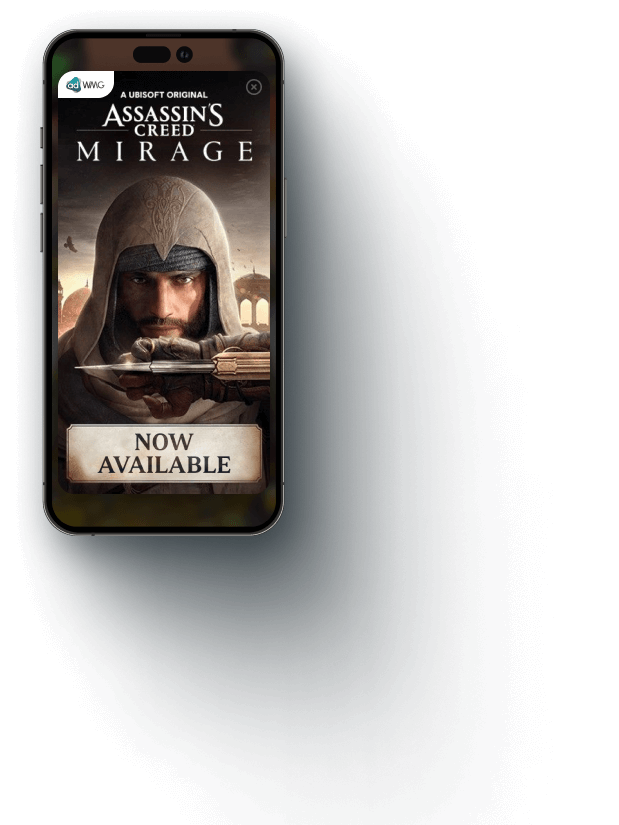
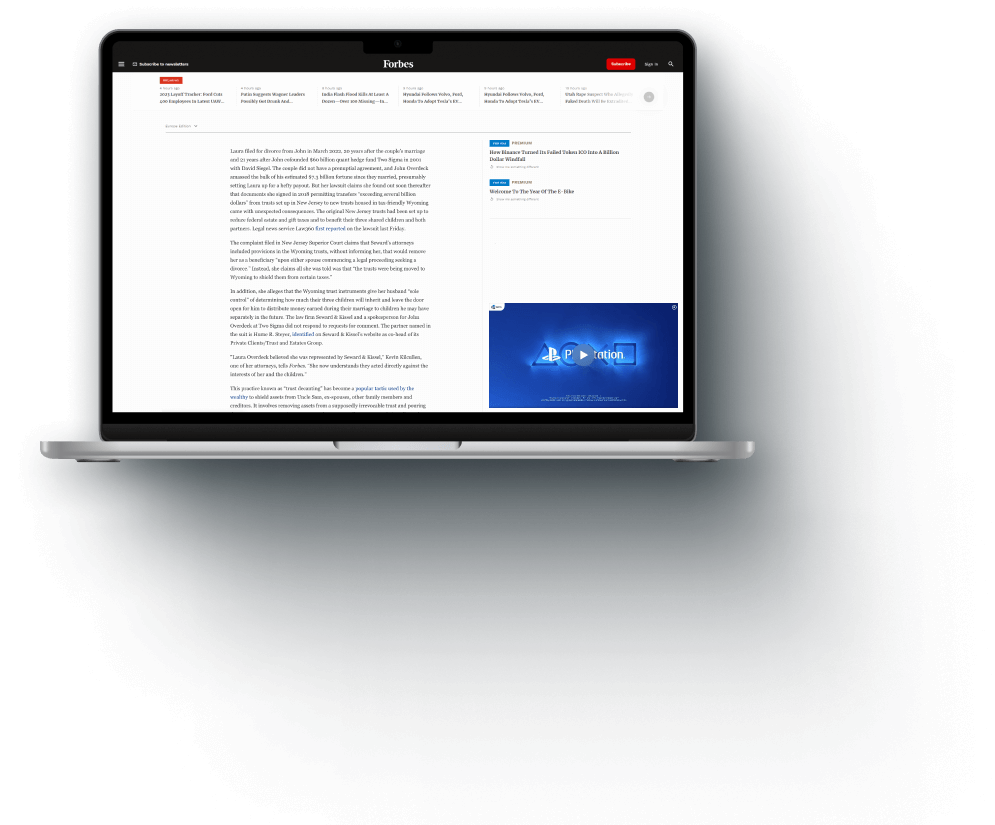
adWMG has developed a unique solution that maximises mobile app game conversion rates by effectively reaching mobile gaming audiences on console gaming devices (such as Xbox and PlayStation). This innovative approach...

How to drive user growth for console and PC games
In an increasingly competitive gaming landscape, getting your console or Steam title in front of the right players can be a major challenge. That’s where adWMG steps in – offering a flexible, no-risk model for performance-driven user...
WMG International ecosystem
Formats
Product
Device
Formats
Product
Integration
 header bidding
wrapper
 adWMG HB
adapter
 header bidding
analytics
 wPlayer video
solution
 Mobile devices
 Desktop
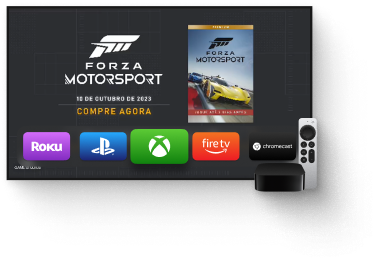 CTV
CTV
Technical core
 Banner
 Audio
Audio
DSP
Direct campaigns
TAM
Header bidding
Open Bidding
SSP
Using the most contemporary technological stack, WMG International creates effective technical solutions for publishers worldwide


Jay Handline

Emin Alpan

Arthur Daniyarov

Shivamshree Urmaliya
Jay Handline

Sheby Ahamed

Hari